Data Warehouse - Design Approach
What is a Data Warehouse?
A Data Warehouse is a large collection of data that is used to correlate broad business data to provide greater insight that can be used to make decisions. The warehouse collects data from different apps and systems on a periodic basis and processes this data before storing it in a consistent way so it can be used later in analysis and decision making.
Note that it is expected that people with skills in software development will interact with the data warehouse. Folks with a need for the information based on the data, will interact with the reports that are created with the data from the warehouse. One way we are making this visible across the organization is by publishing Power BI reports and dashboards to a workspace that anyone at Medtronic can request access to.
Please review this document for more information on how to get started with Power BI and other reports.
Our current needs revolve mostly around collecting and aggregating data from disparate sources such as Azure DevOps, SonarQube and Enterprise Architect, so that we can provide various groups with information and reports that can be used as part of release reporting and planning as well as providing insights to developer activities and concerns.
Data Drives DevOps Maturity
Before diving too deep into the data that is or will be in the DevOps Data Warehouse today, it is important to ground the reader in the high level goals of this data. To that end, the driving force behind the development of this warehouse is to provide data that will help our organization in our DevOps journey. Accordingly release reporting (especially when the data for these reports is in disparate systems) is a major part along with what we're calling DevOps Maturity Leading Indicators. These Leading Indicators are based on the 4 main metrics published in the DORA Report.
DORA Report's DevOps Maturity Metrics
- Deployment Frequency
- How often is code deployed to production?
- Lead time for changes
- How long does it take to go from code committed to code running in production?
- Time to restore services
- How long does it take to restore a service that impacts users?
- Change failure rate
- What percentage of changes to production result in degraded service and require remediation (like a hot fix)?
Within each of these categories we can ask "why" a given value is not at the level we expect, and begin to formulate leading indicator metrics that can provide some insight into why we're not as mature in the DevOps maturity spectrum as we'd like to be. A non-technical example of a leading indicator is to track caloric intake or minutes of exercise when trying to lose weight. Those are the leading indicators that should have an effect on the lagging indicator, weight loss. For example relevant to the topic at hand, we can look at branch age and how many user stories are completed in a given release as a leading indicator for Lead Time for Changes.
Available Data in the DevOps Data Warehouse
Here is a high level diagram illustrating what data from Azure DevOps is stored in one of the Cosmos Databases that makes up the DevOps Data Warehouse.
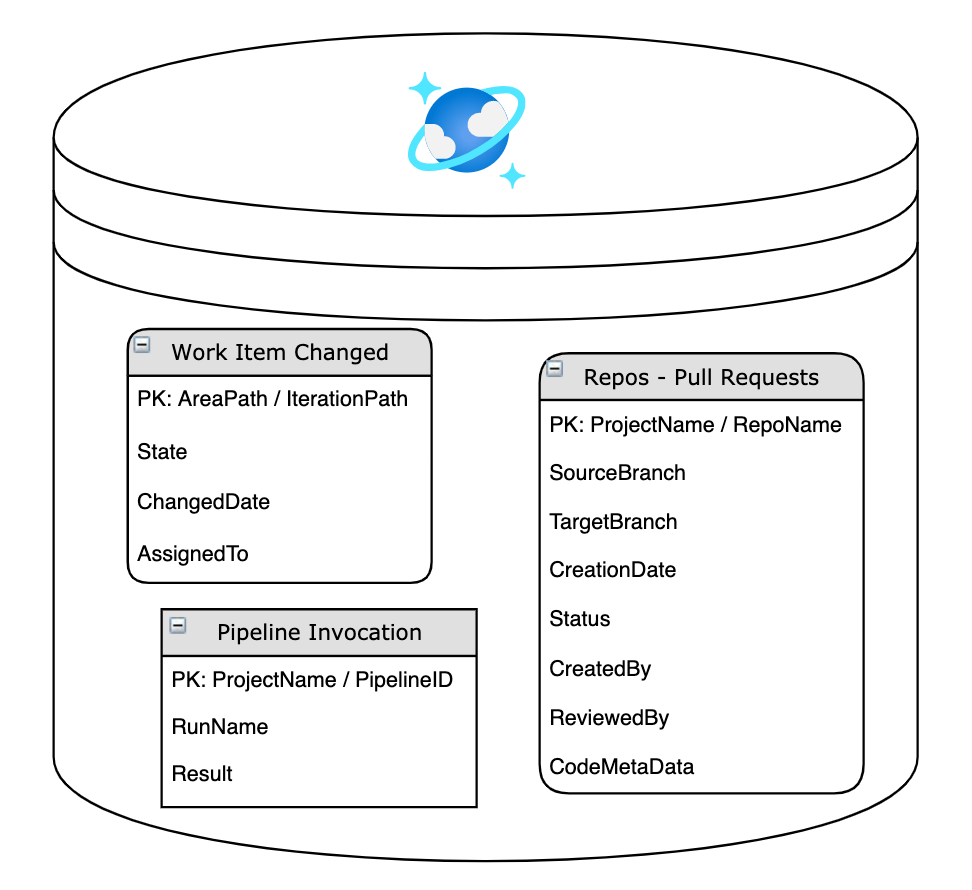
Note that there will be multiple databases (one for each data source as mentioned above) and this illustration is only showing the data captured from Azure DevOps. Each box is "container" (aka a table) within the database and is based on an event from Azure DevOps. It should be noted that there is more data stored in each container than is shown in the image above, but the data specified in this image is what we think is most important to mention.
For more information about the structure of Cosmos and language used from the Microsoft perspective take a look at this diagram and the following documentation:
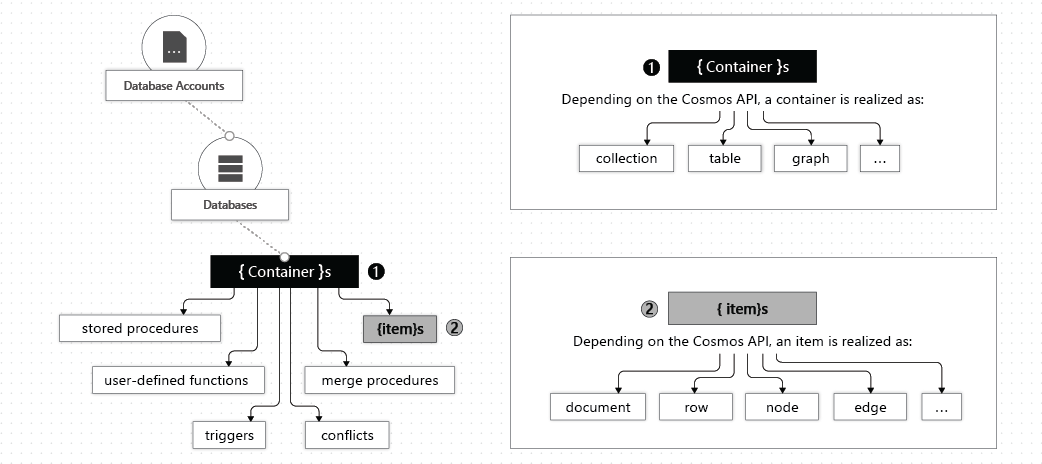 https://docs.microsoft.com/en-us/azure/cosmos-db/account-databases-containers-items
Now let's look at the data in each container.
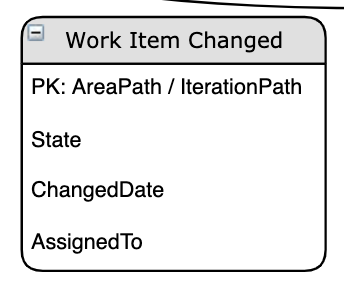
To help inform the Lead Time to Change metric that is part of the DORA report, it is important to know how long it takes for a work item to go from new to active and active to resolved and finally resolved to closed.
It is likely that we will look at this indicator on a team by team basis and/or within a certain time frame. For that reason and due to the way this will map to partitions in the container, we have chosen to use the area and iteration path as the partition key in this container.
The API used to collect the data is this: https://docs.microsoft.com/en-us/rest/api/azure/devops/wit/work%20items/get%20work%20item?view=azure-devops-rest-6.0#examples
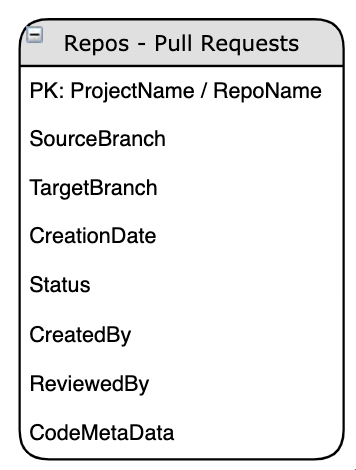
Similarly and still working towards metrics related to Lead Time to Change as well as a leading indicator for Deployment Frequency, the data above is captured on a Pull Request event. The APIs leveraged are below: - https://docs.microsoft.com/en-us/rest/api/azure/devops/git/pull%20requests/get%20pull%20requests%20by%20project?view=azure-devops-rest-6.0 - https://docs.microsoft.com/en-us/rest/api/azure/devops/git/pull%20requests/get%20pull%20request?view=azure-devops-rest-6.0
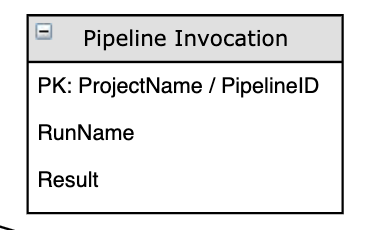
To further supplement the data above along with some additional information about success rates, we are capturing information related to Pipeline invocations. The APIs we will leverage are below: - https://docs.microsoft.com/en-us/rest/api/azure/devops/pipelines/pipelines/list?view=azure-devops-rest-6.0 - https://docs.microsoft.com/en-us/rest/api/azure/devops/pipelines/pipelines/get?view=azure-devops-rest-6.0 - https://docs.microsoft.com/en-us/rest/api/azure/devops/pipelines/runs/list?view=azure-devops-rest-6.0 - https://docs.microsoft.com/en-us/rest/api/azure/devops/pipelines/runs/get?view=azure-devops-rest-6.0
Some Technical Details of Current Implementation
Because of the nature of the data coming in from these various sources and to create a more maintainable and flexible schema, we've chosen to implement the data storage part of the warehouse with Cosmos, a NoSQL database option.
The current approach for the DevOps Data Warehouse will be to have one Cosmos DB per data source (e.g. Azure DevOps or SonarQube) with at least one container per metric. It is likely that many of these metrics will require two containers - one for the current state and one for historical records.
Database account names should follow a pattern like this: [datasource]-metrics-cosmos . So an example of this would be azdo-metrics-cosmos and sonar-metrics-cosmos.
The naming of the individual databases within the database account become a little more specific and should follow a naming convention like this: [datasource]-[source-object]-db. Examples of this would be azdo-workitems-db and azdo-testitems-db.
Containers should follow a naming convention like this: [source-object]-[partition-key]. So an example of this would be workitem-area-iteration for a container in the azdo-metrics-cosmos database that will be used to store data about work items using the area and iteration path as the compound partition key.
Another interesting benefit of using Cosmos is that we can use Azure Data Factory to copy data from various sources, including excel. Once someone has the data available in excel it can be moved and used almost anywhere.
Data Lifecycle
There is a limit of 20 GB for each partition within a container. We attempted to design the partition keys so that this limit is not hit for some time. However, eventually the limit will be hit so we need to have a data retention strategy. A general rule of thumb will be to migrate data from Cosmos to cold storage after 12 months. This time was chosen because generally products are released every quarter so this will provide some indication of trends and hopefully not go over the limit of a partition. We will also need to periodically check the size of each partition so that we can proactively prevent data loss due to partition size.
This blog is a nice summary of data retention in Azure: https://www.linkedin.com/pulse/azure-cosmos-db-design-patterns-andrei-zaichikov
Contributing to the DevOps Data Warehouse
As we develop the DevOps Data Warehouse there will be things you want to see that we are not currently capturing. When this happens you should schedule some time with the Energizers team so that we can determine how to uncover what you are looking for.
It may be decided that your team will contribute code to populate the DevOps Data Warehouse, and if that is the case you need to have some background on how we've structured that work up to this point. Start by taking a look at this repo (only viewable if you have at least reader access to the MDTProductDevelopment organization): https://dev.azure.com/MDTProductDevelopment/enablement/_git/azdo-metrics-capture-utility
The current expectation is to have a repository per data source. That means we will have multiple Azure Functions in a single repo.